Cisco SD-WAN - Getting Started
Introduction
SD-WAN is a software-defined approach to managing the WAN. In the past, MPLS networks were used to ensure reliable connectivity between users connecting at the branch to applications running on servers in the datacenter. SD-WAN is a new approach to building out WAN networks. It will help organizations to manage their WAN network from a single pane of glass, ensuring optimized routing paths, ensuring high availability for enterprise applications and easily connect your WAN Network to the cloud.
Documentation
Documentation can be found by logging into the vManage and go to `/apidocs’. So for the SD-WAN Devnet Always On Sandbox, we could use https://sandboxsdwan.cisco.com/apidocs.
Credits
Most of the examples below are making use of Nick Russo’s SD-WAN POSTMAN collection. Find them at Nick’s website (here). Also, Nick has a brilliant course on SD-WAN at Pluralsight. Really worth watching it if you want to explore how to run APIs against Cisco’s SD-WAN solution. Check out Nick’s course Automating Cisco SD-WAN Operations Using APIs here).
Authenticate
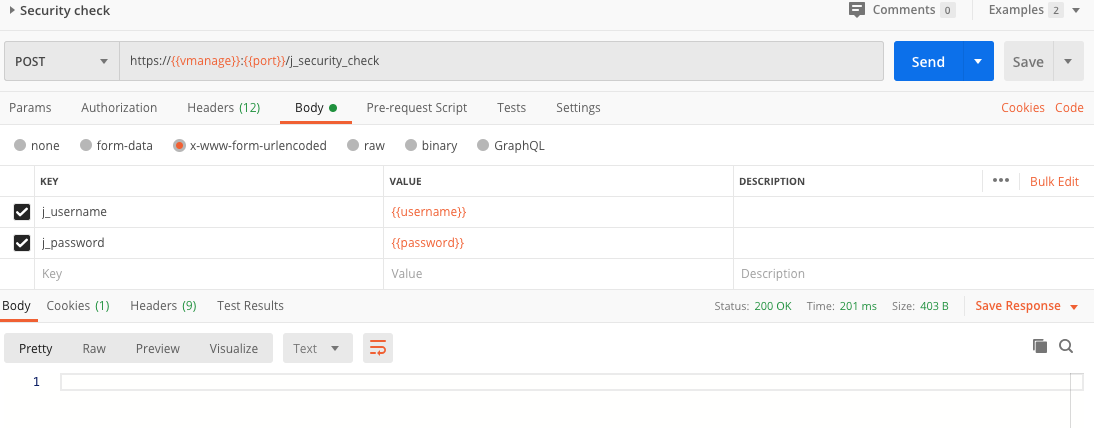
First off, we need to authenticate with the SDWAN solution. Therefore we need to send a POST request to https://{{vmanage}}:{{port}}/j_security_check. In the body, we need to specify the username (called j_username) and password (j_password). Have a look here to get acquainted with the API
Get device controllers
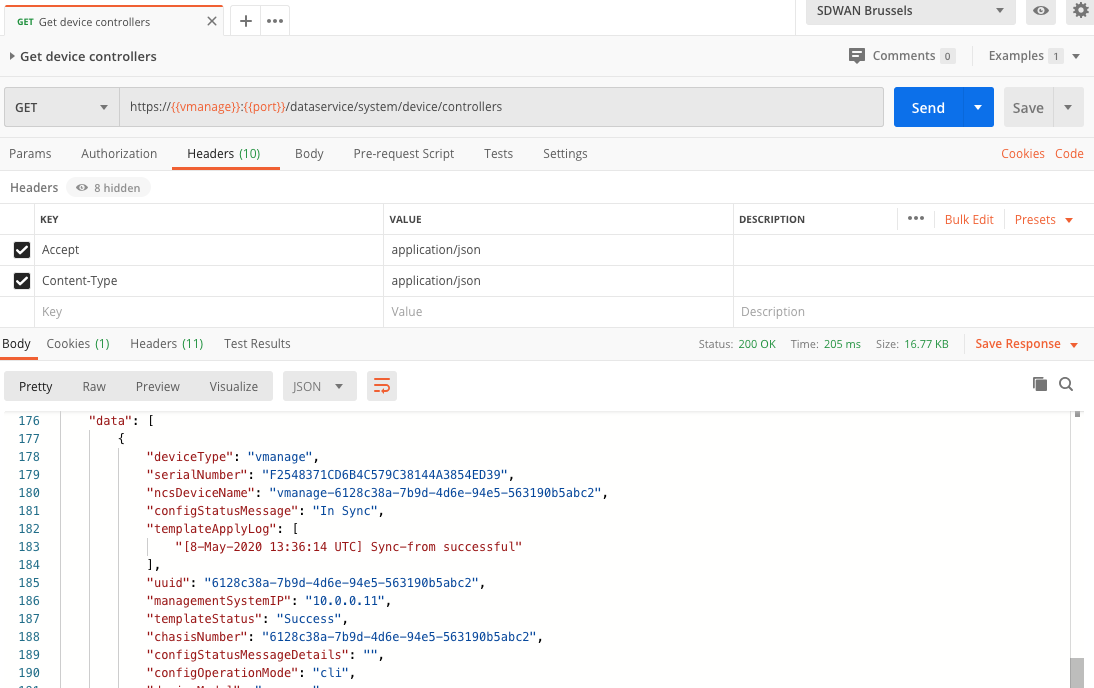
With authentication out of the way, we can now focus on retrieving some data. In the next script, we will retrieve a list of device controllers from our SD-WAN setup. Code is pretty easy.
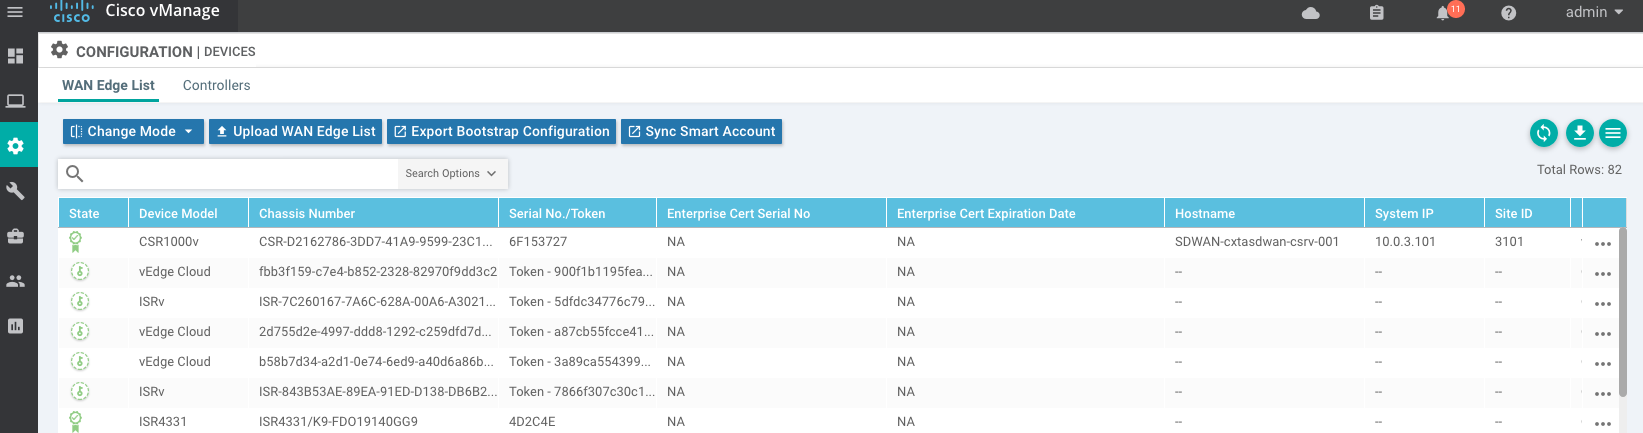
Get edge devices
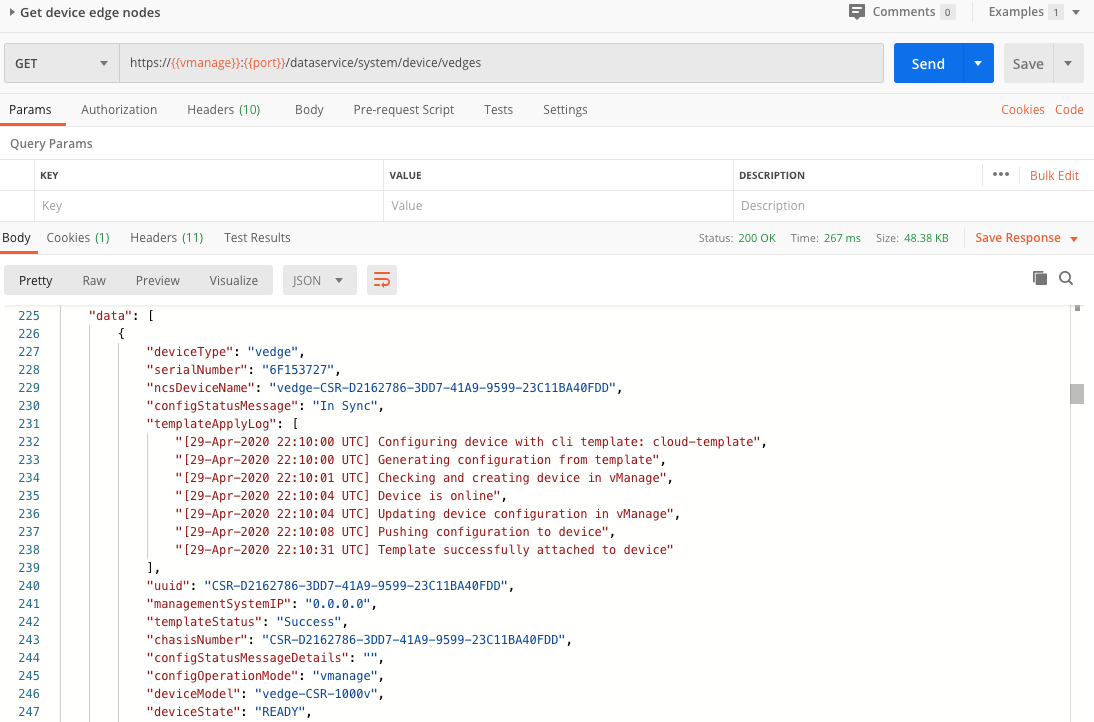
In the above script, we retrieved the device controllers. With a small variation to the above script we can also retrieve a list of vEdge devices. Just call the /dataservice/system/device/vedges API.
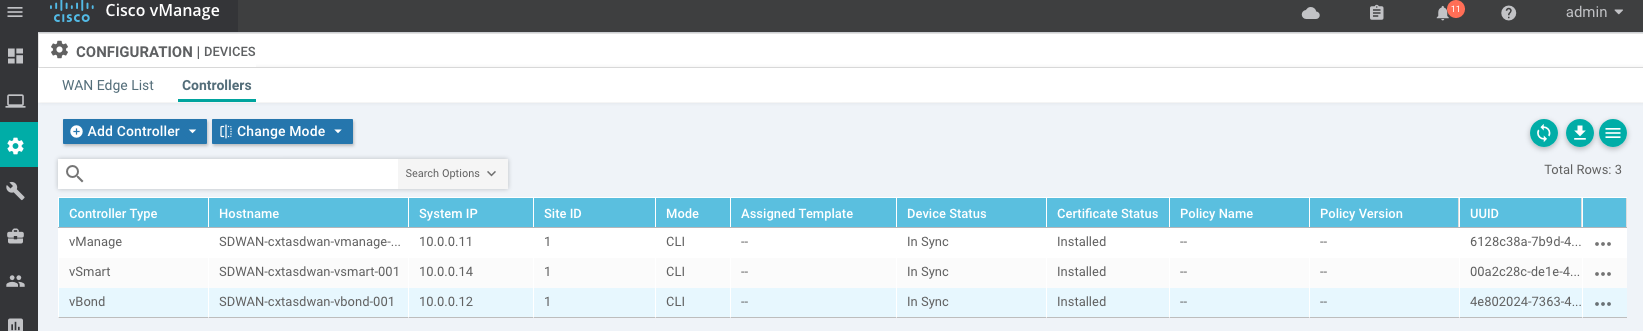
Obviously, the POSTMAN response is also reflected in the
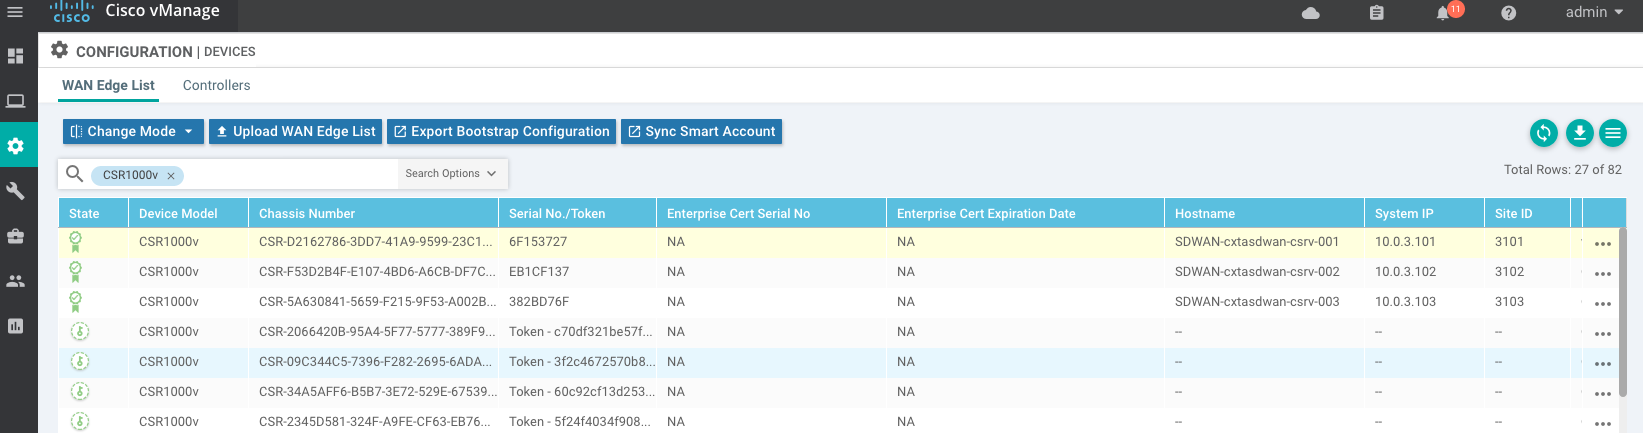
Let’s say we would only be interested to have an overview of the CSR1000v edge devices. Then the API allows us also to ‘filter’ the response by using a query parameters. See below for the relevant POSTMAN example.
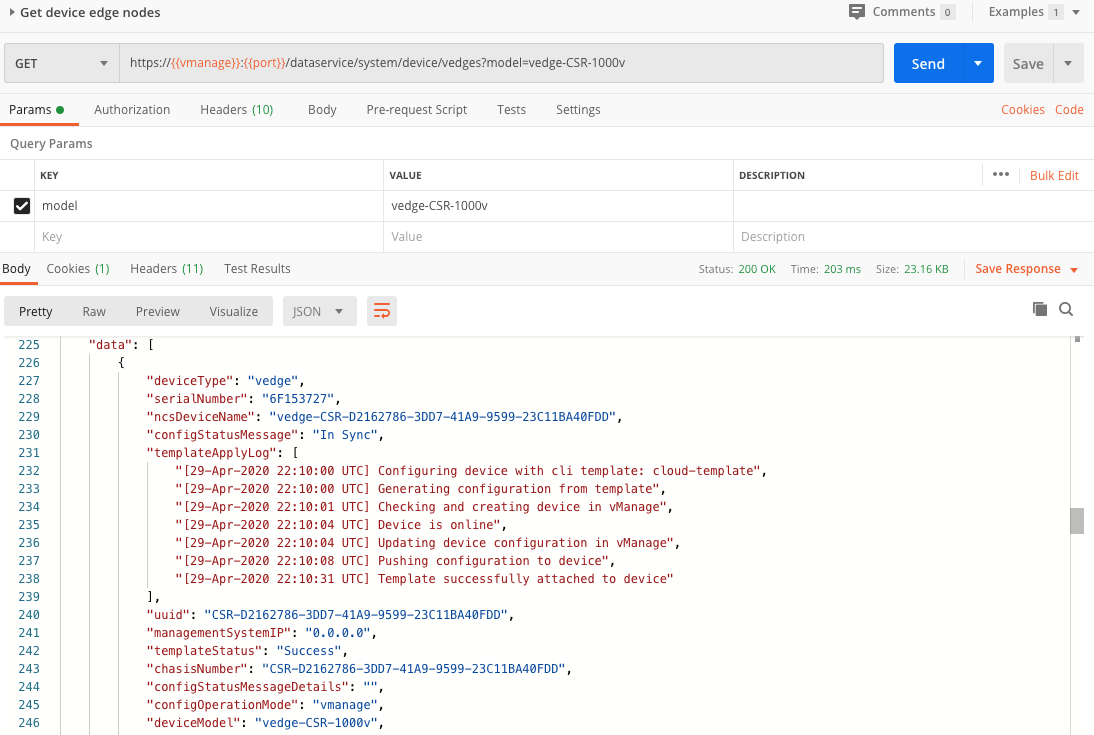
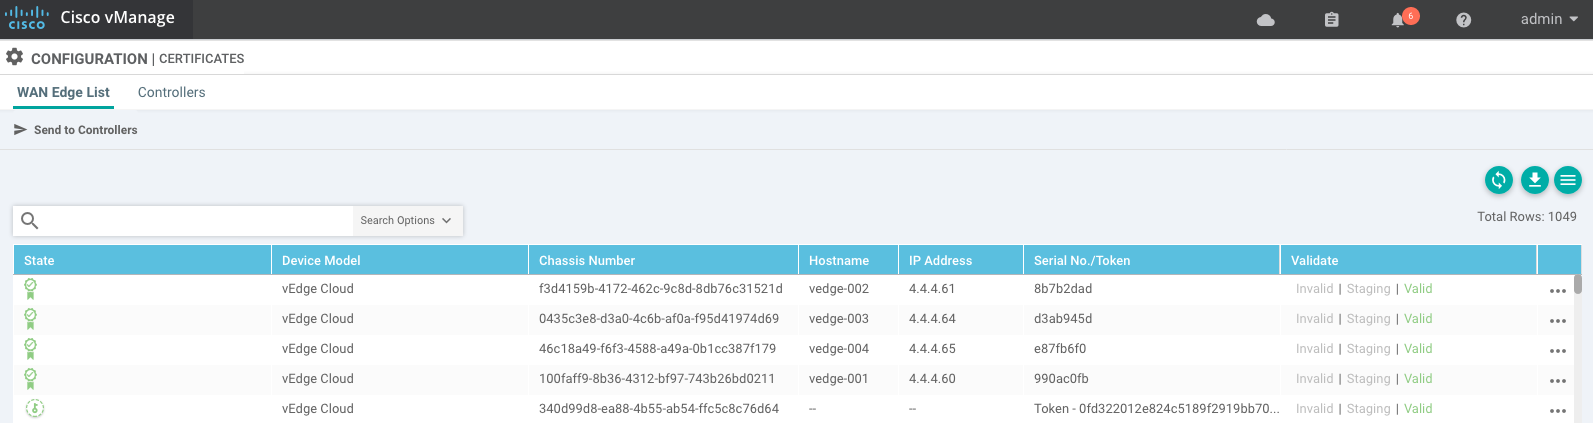
As you would expect, the returned list of CSR1000v correspond to the list in the SD-WAN user interface.
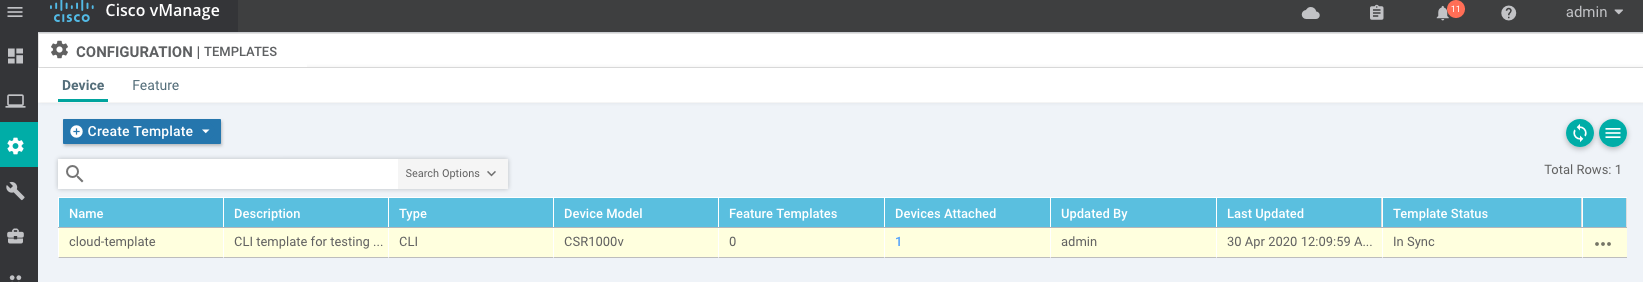
Get templates
In order to retrieve templates from vManage, we will use the /dataservice/template/ API.
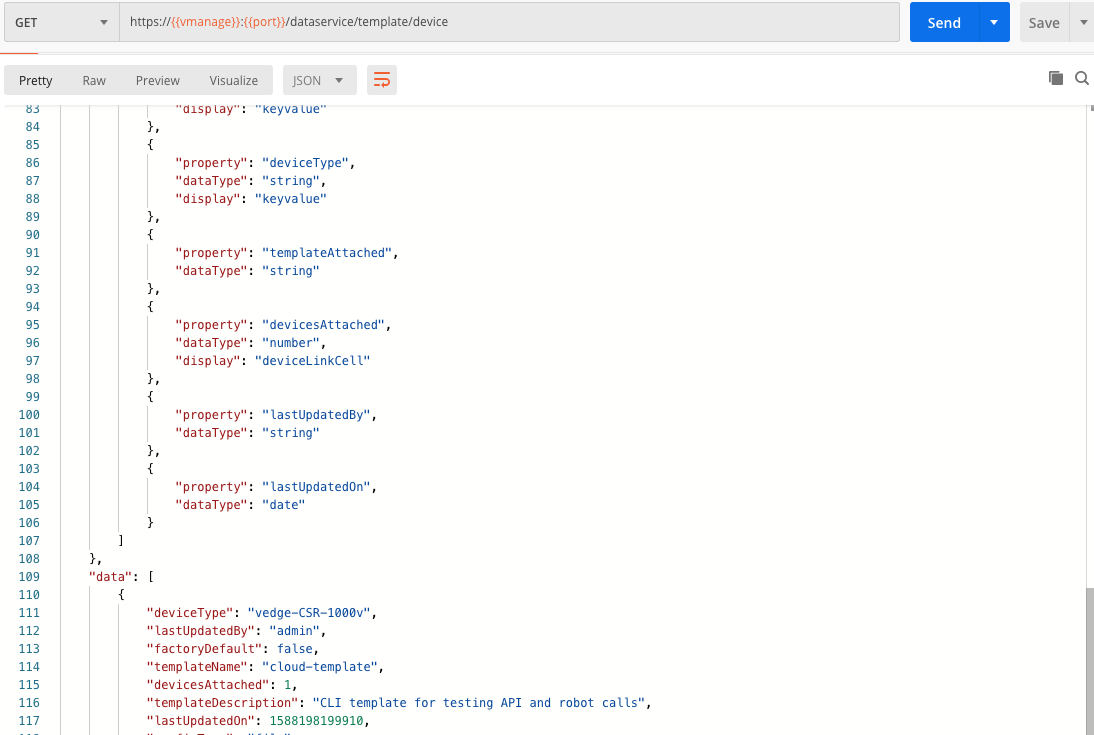
Checking the templates in the user interface of course gets us back the same list of templates.
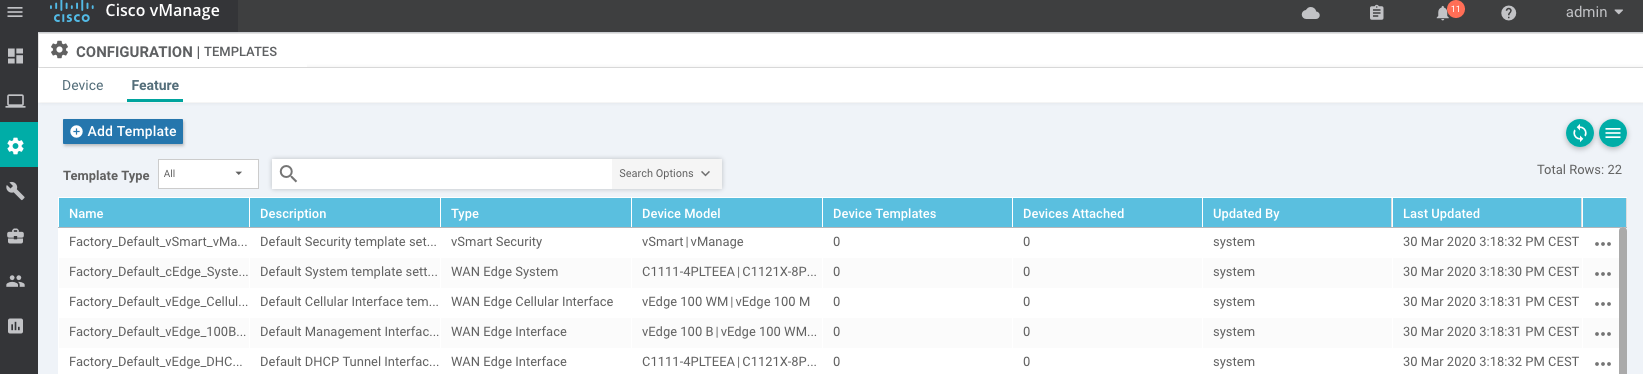
Get feature template
SD-WAN works with so called feature templates. Retrieving these feature templates is very similar to retrieving templates. We will use the /dataservice/template/feature API.
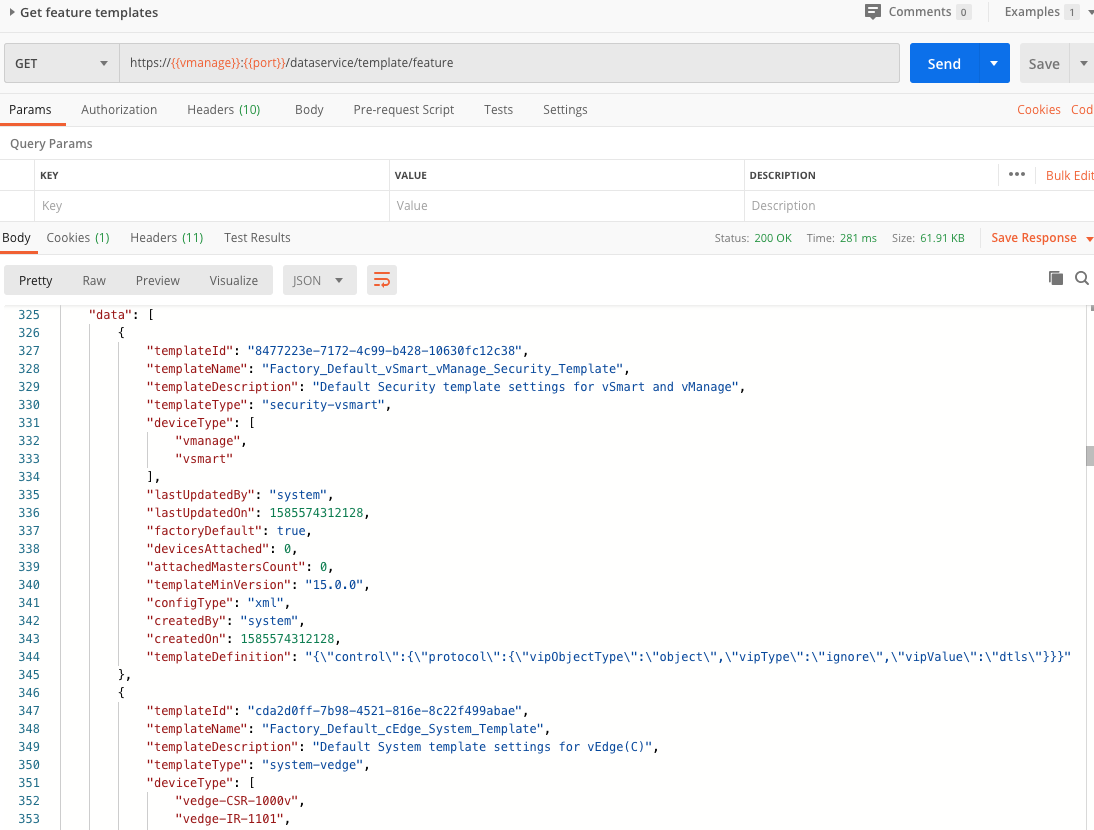
Below the UI with the same feature templates.
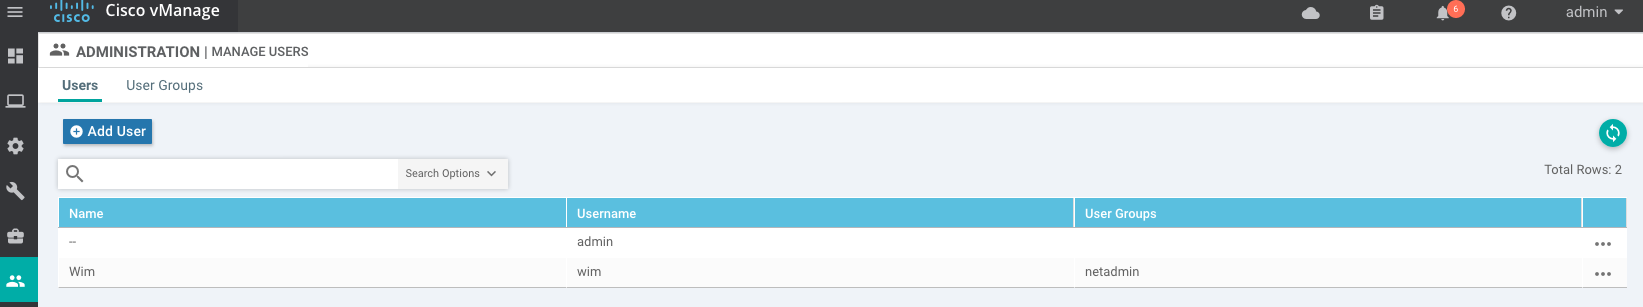
Add user
Adding users to an existing group is done through sending a POST request to the /dataservice/admin/user API. Note the capital N in userName in the JSON body (if spelled wrong, the user will not be added).
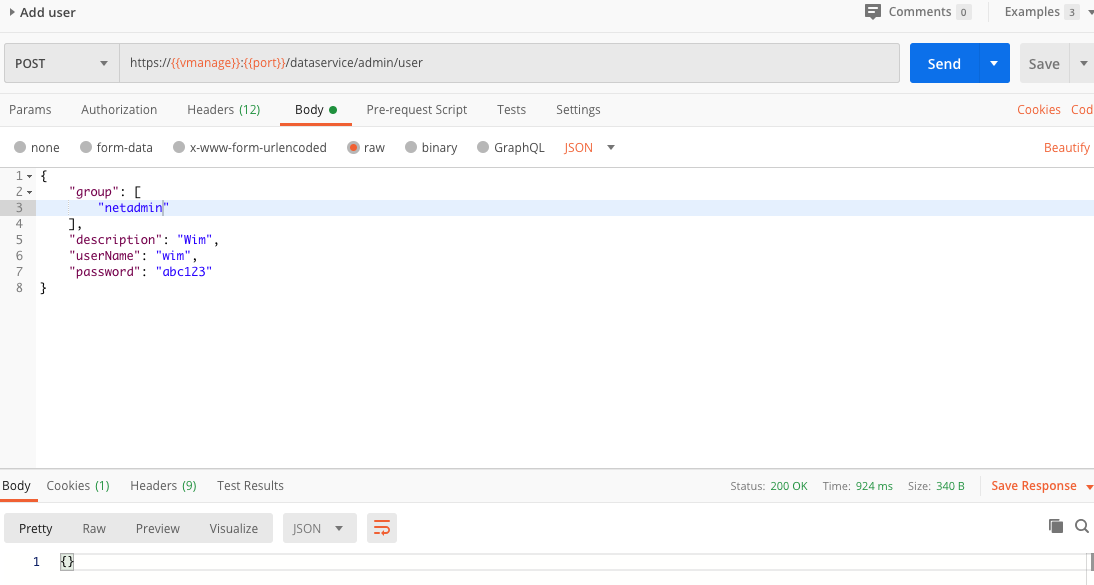
If all works well, the user is added here.
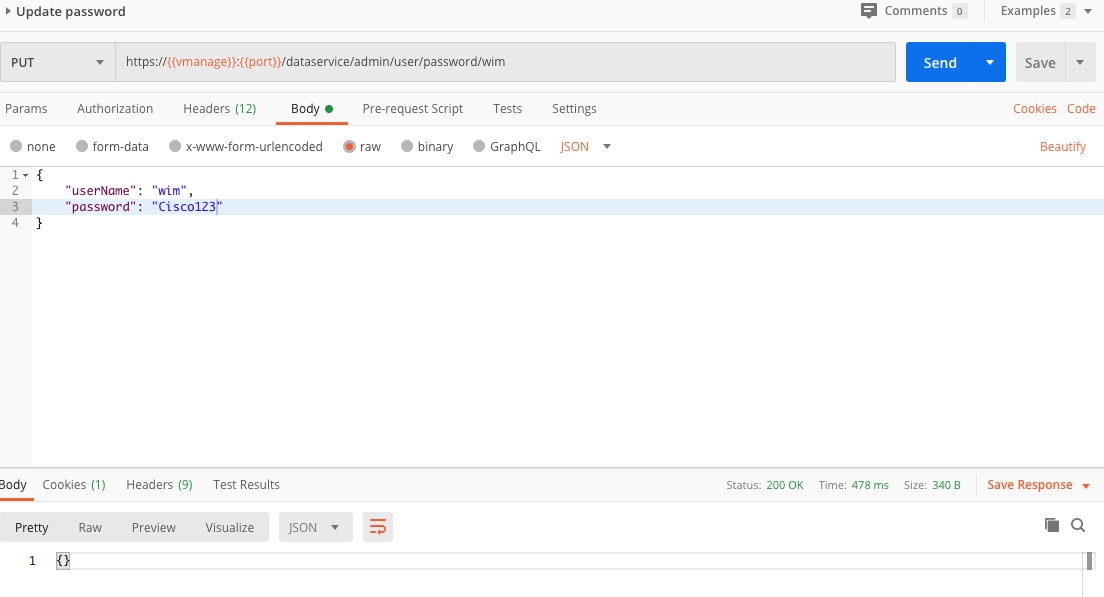
Change Password
Also changing the password through the API is possible. For this, use the /dataservice/admin/user/password/<user> API.
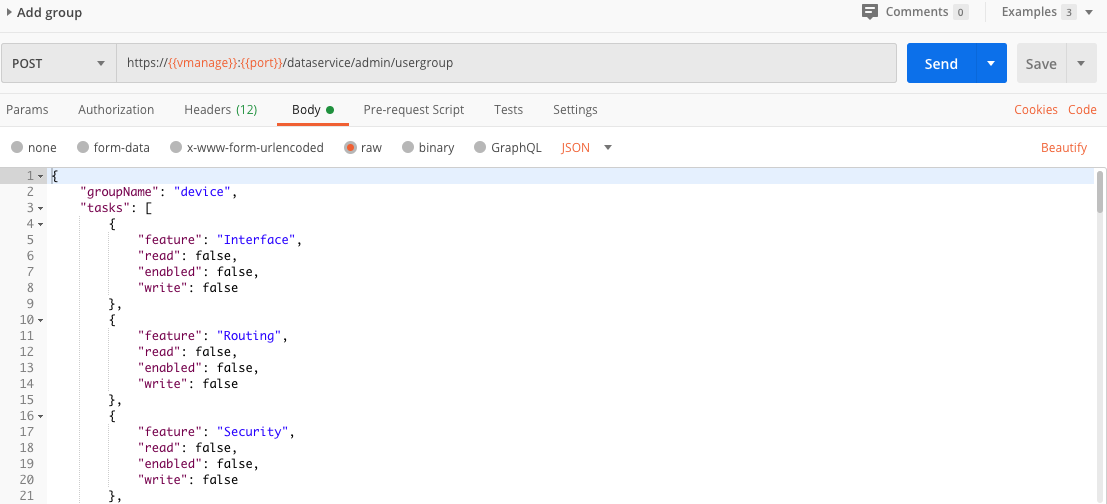
Add Group
Let’s say we wanted to add a new group, we could use the /dataservice/admin/usergroup API. In the JSON body, we can set read/write permissions for specific features. Features include Interface, Routing, Security, System, Policy, Alarms, Audit Log, Device Monitoring, Certificates, Device Inventory, Template Configuration, Template Deploy, Policy Configuration, Security Policy Configuration, Policy Deploy, Cloud OnRamp, Software Upgrade, Device Reboot, Manage Users, Tools, Settings, Cluster, vAnalytics and Events.
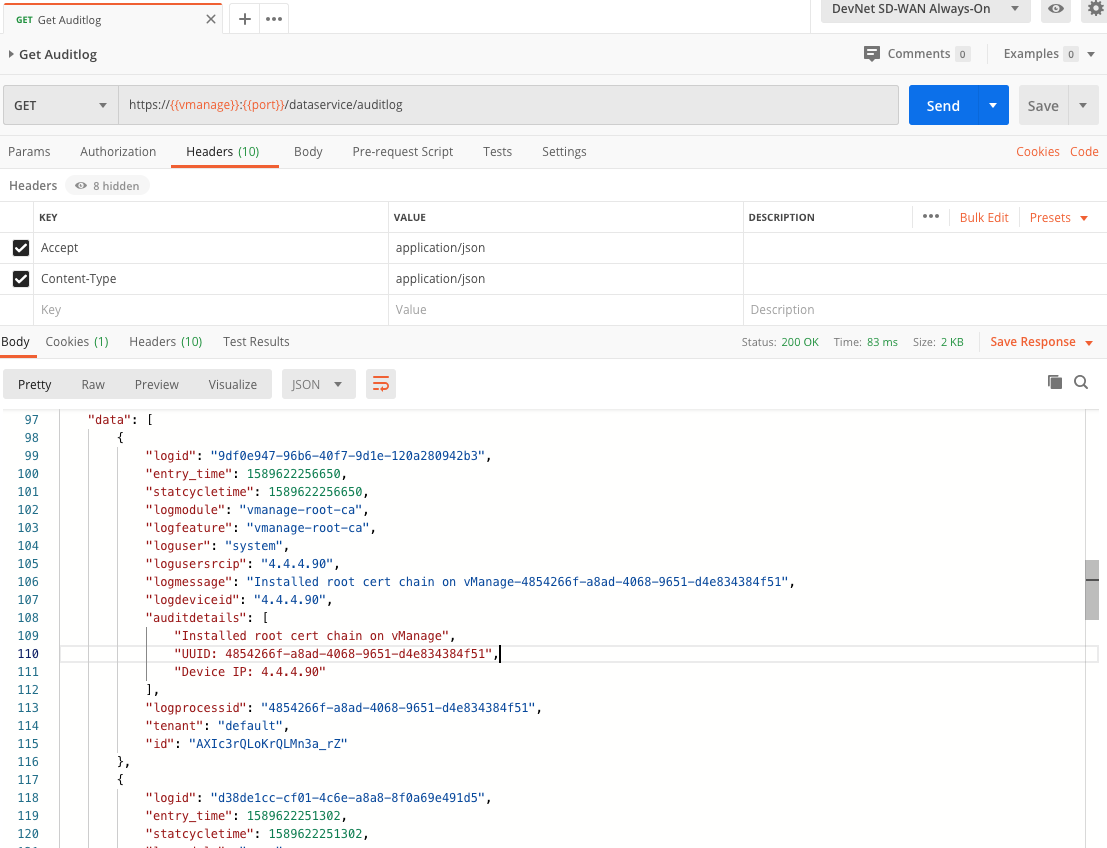
Get Auditlog
To retrieve the auditlog, we can use the API endpoint /dataservice/auditlog. The audit log contains security related events
Note: in order to collect auditlogs, we need to be an admin user. To check if a user is an Admin, you could use the dataservice/admin/user/role API.
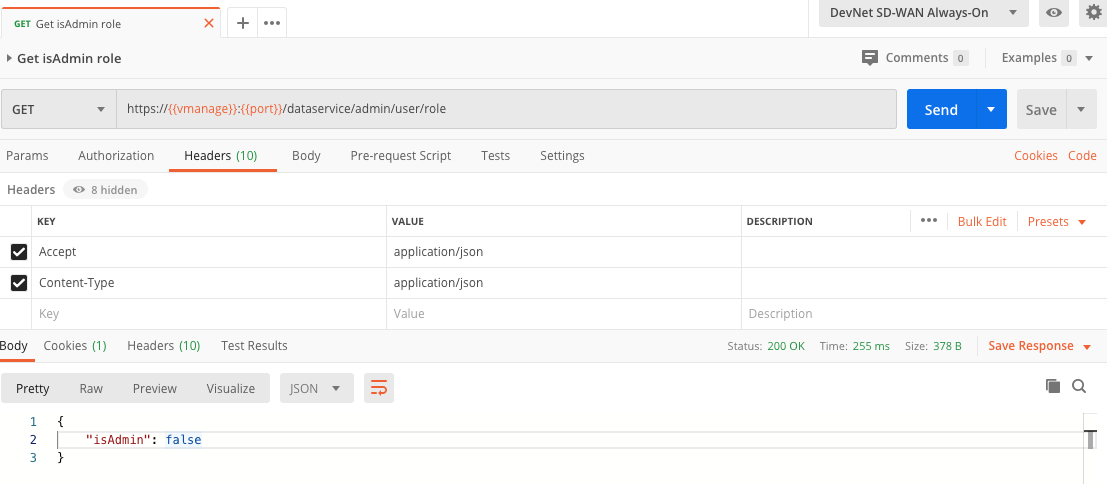
It will return true if the current user has admin privileges.
Get Certificates
In order to retrieve the certificates, you can use the /dataservices/certificate/vsmart/list API.
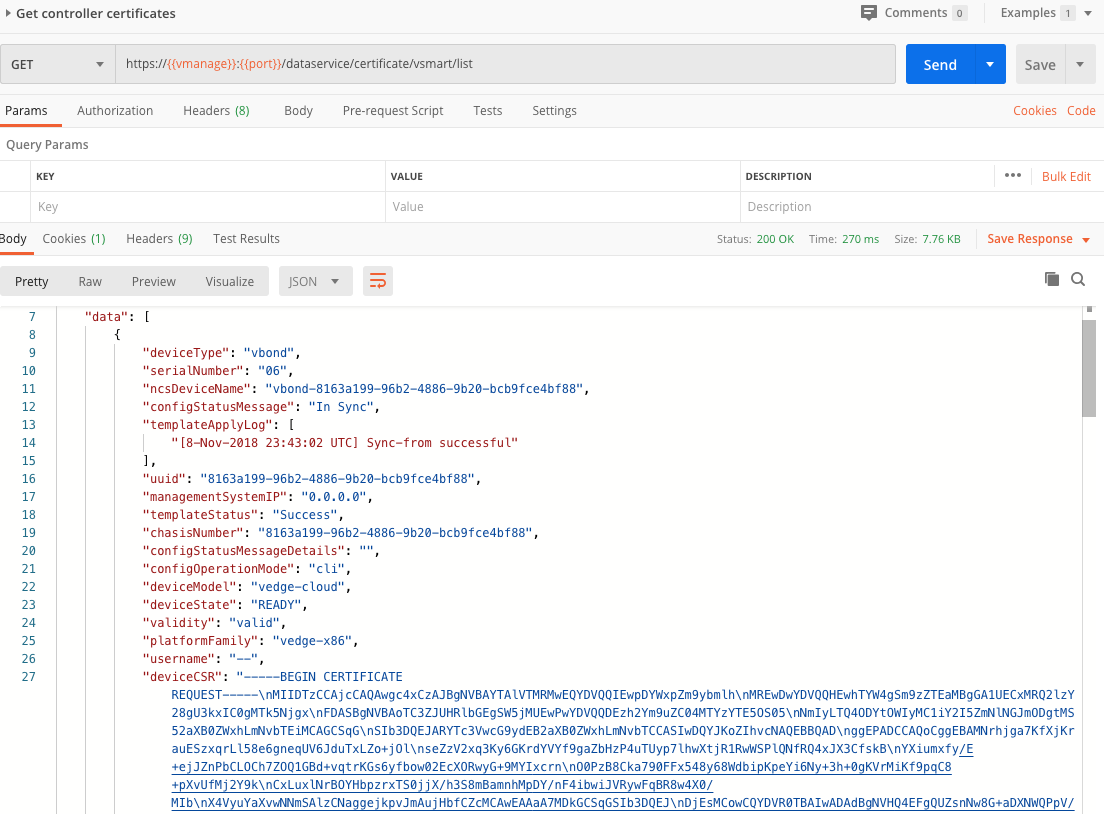
Below is a screenshot showing the list of certificates.
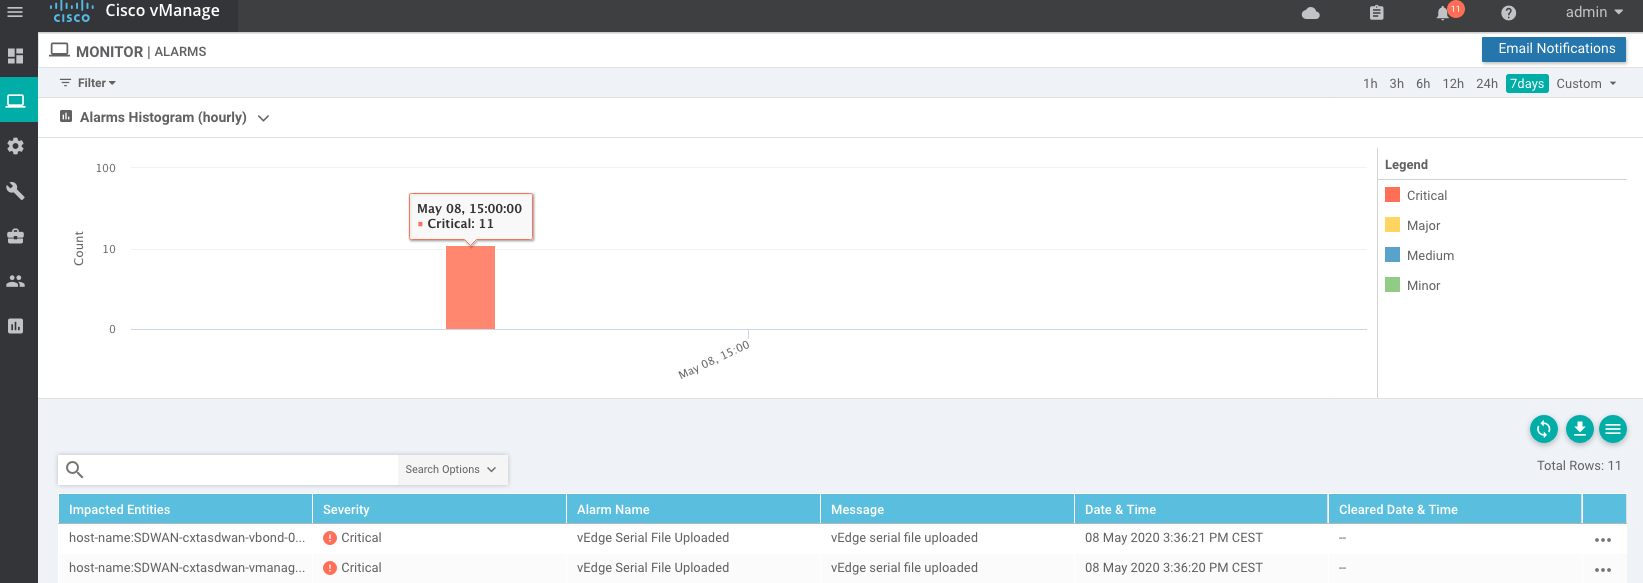
Get alarm count
We can also retrieve the alarm counts. Use the /dataservice/alarms/count API` for that.
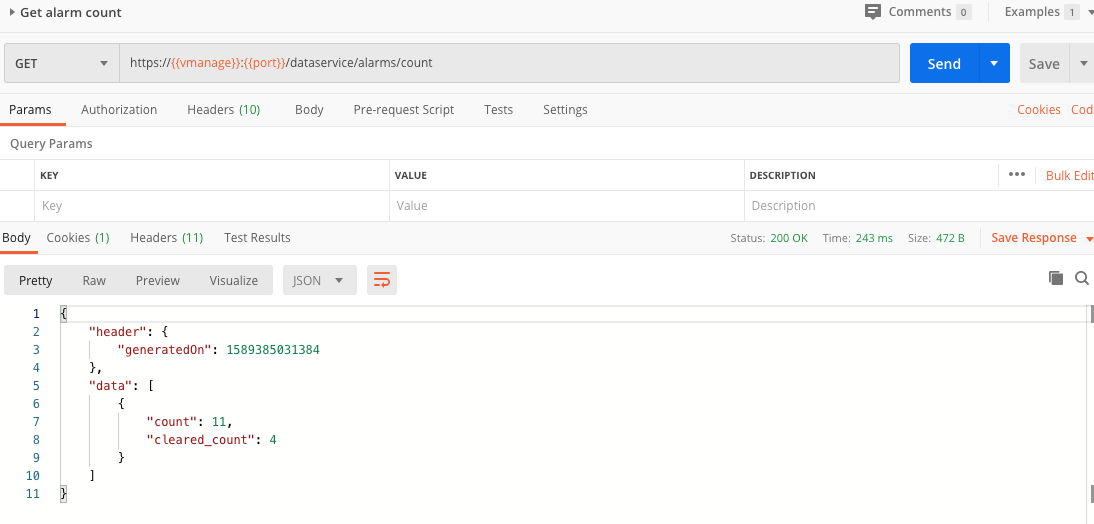
You’ll see we receive back a response with the alarm count and the amount of cleared alarms.
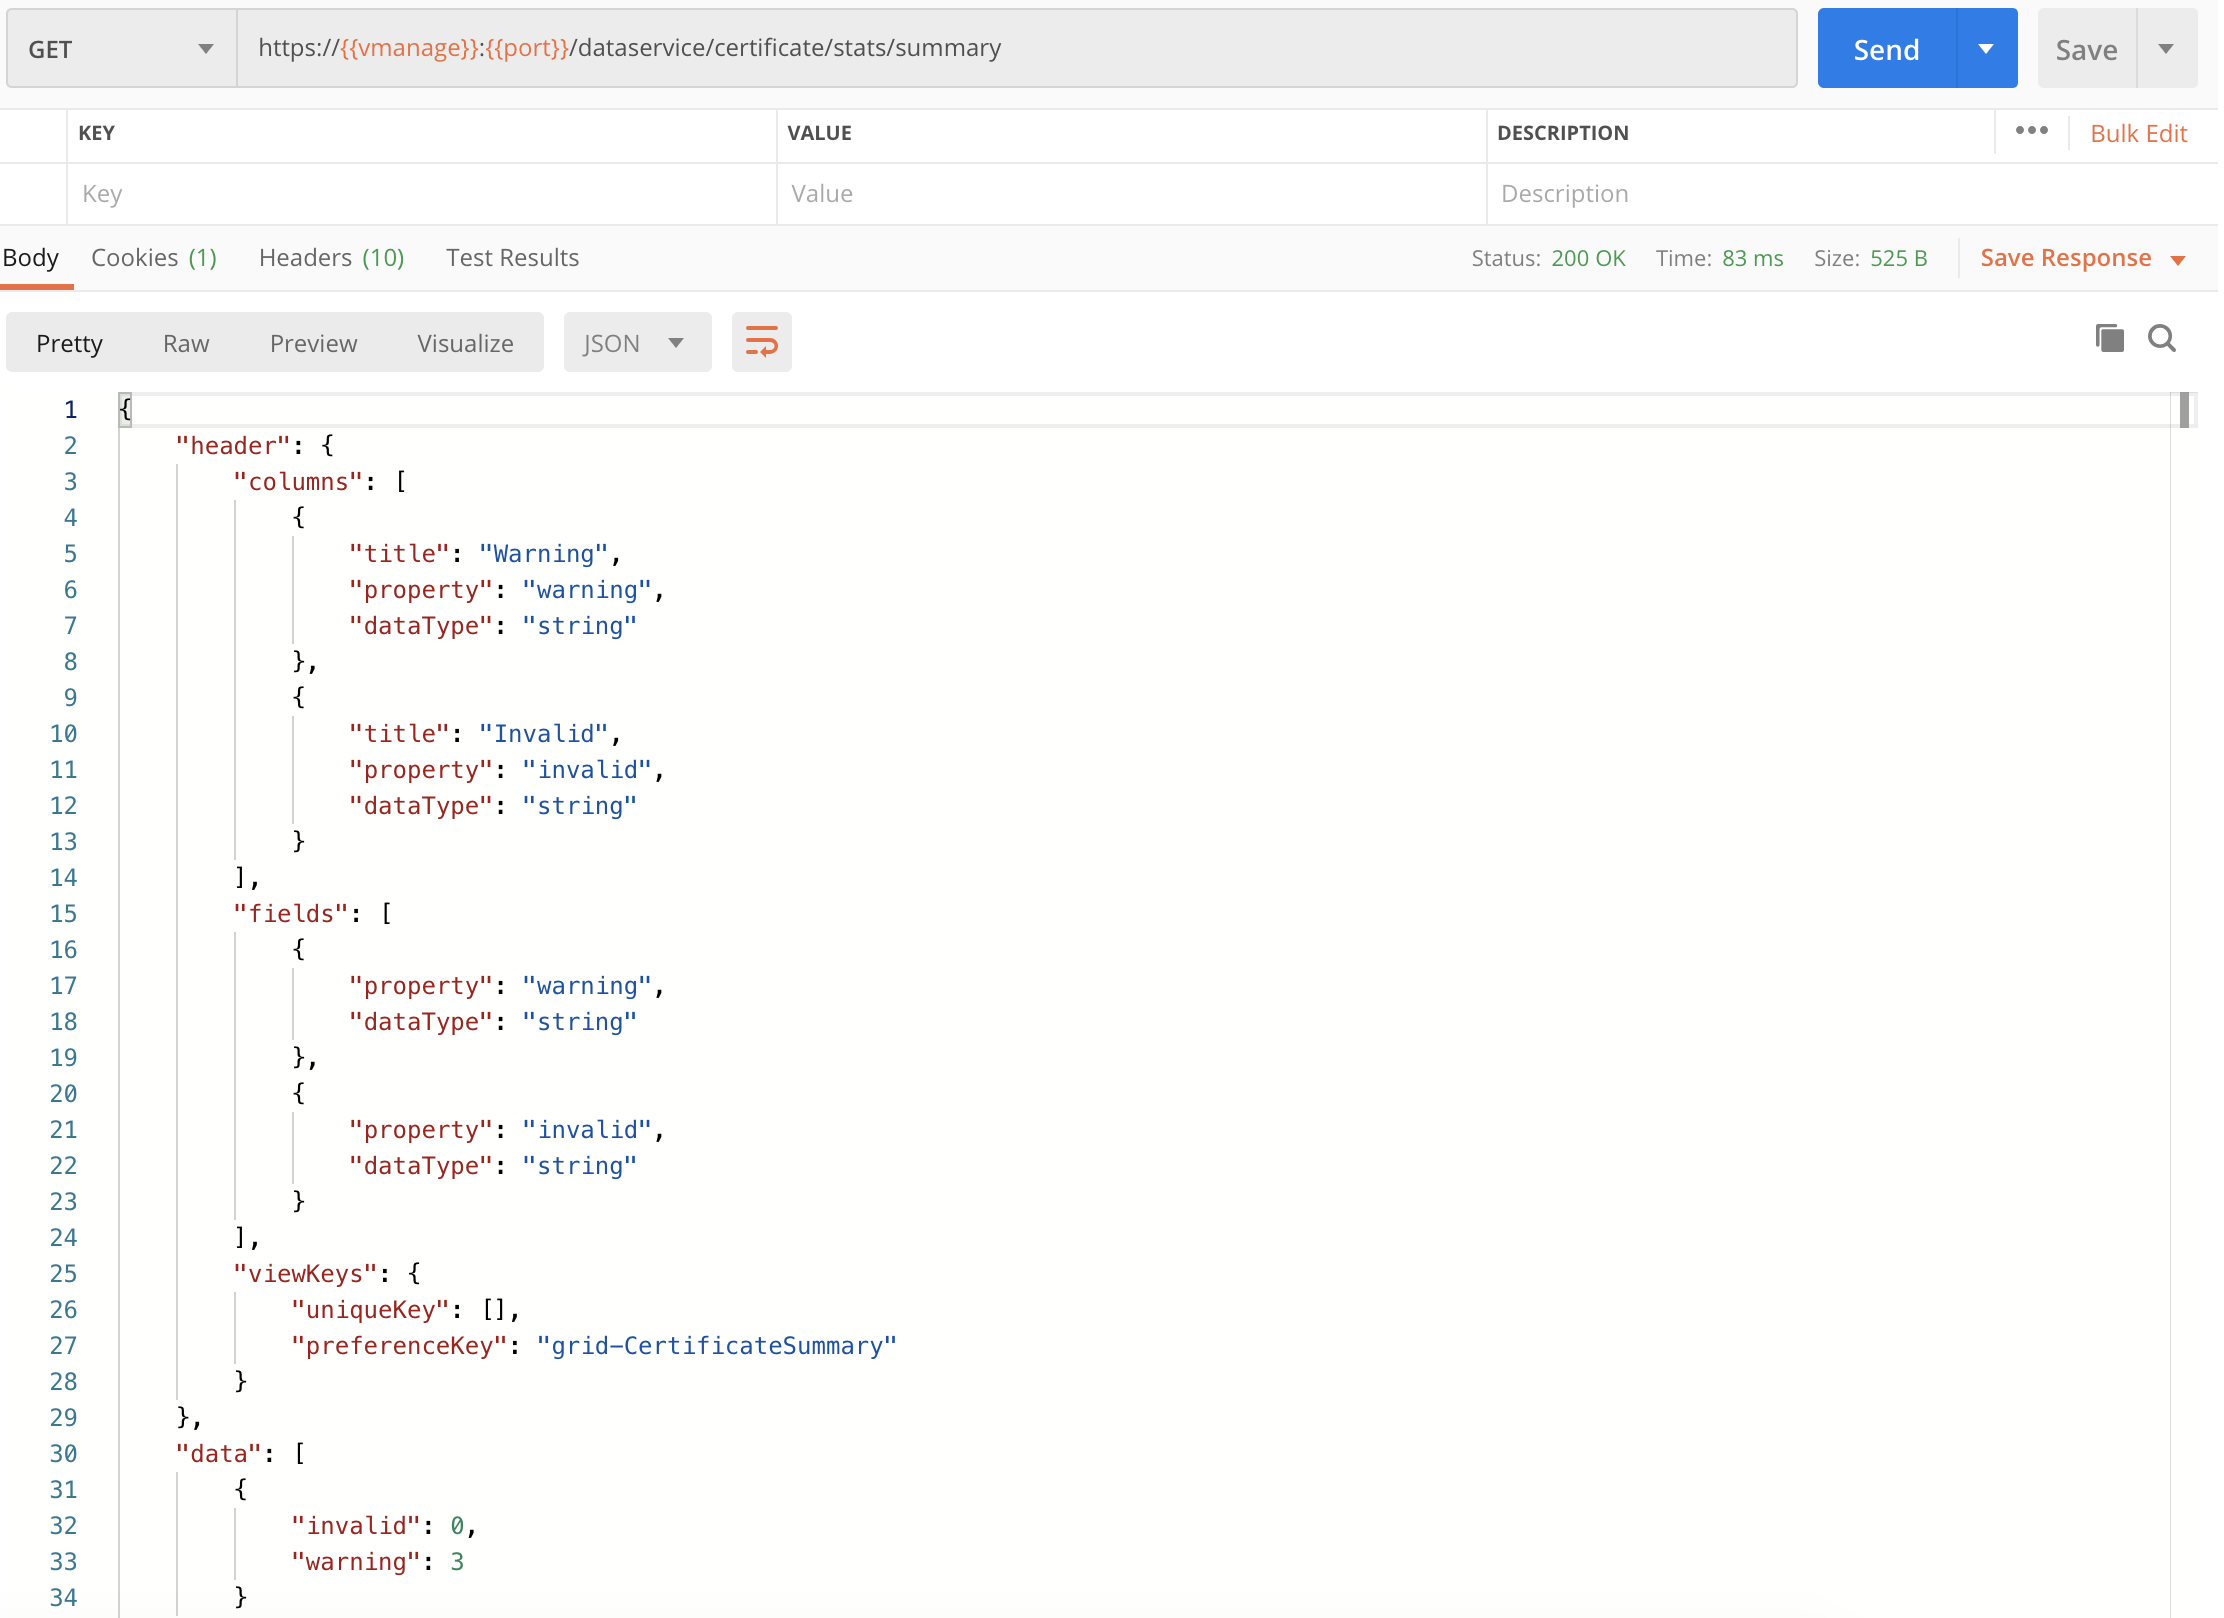
Get Certificates statistics
In order to retrieve the certificates statistics, you can use the /dataservices/certificate/stats/summary API.
Get Control Count
In order to retrieve the control count, you can use the /dataservices/device/control/count API.
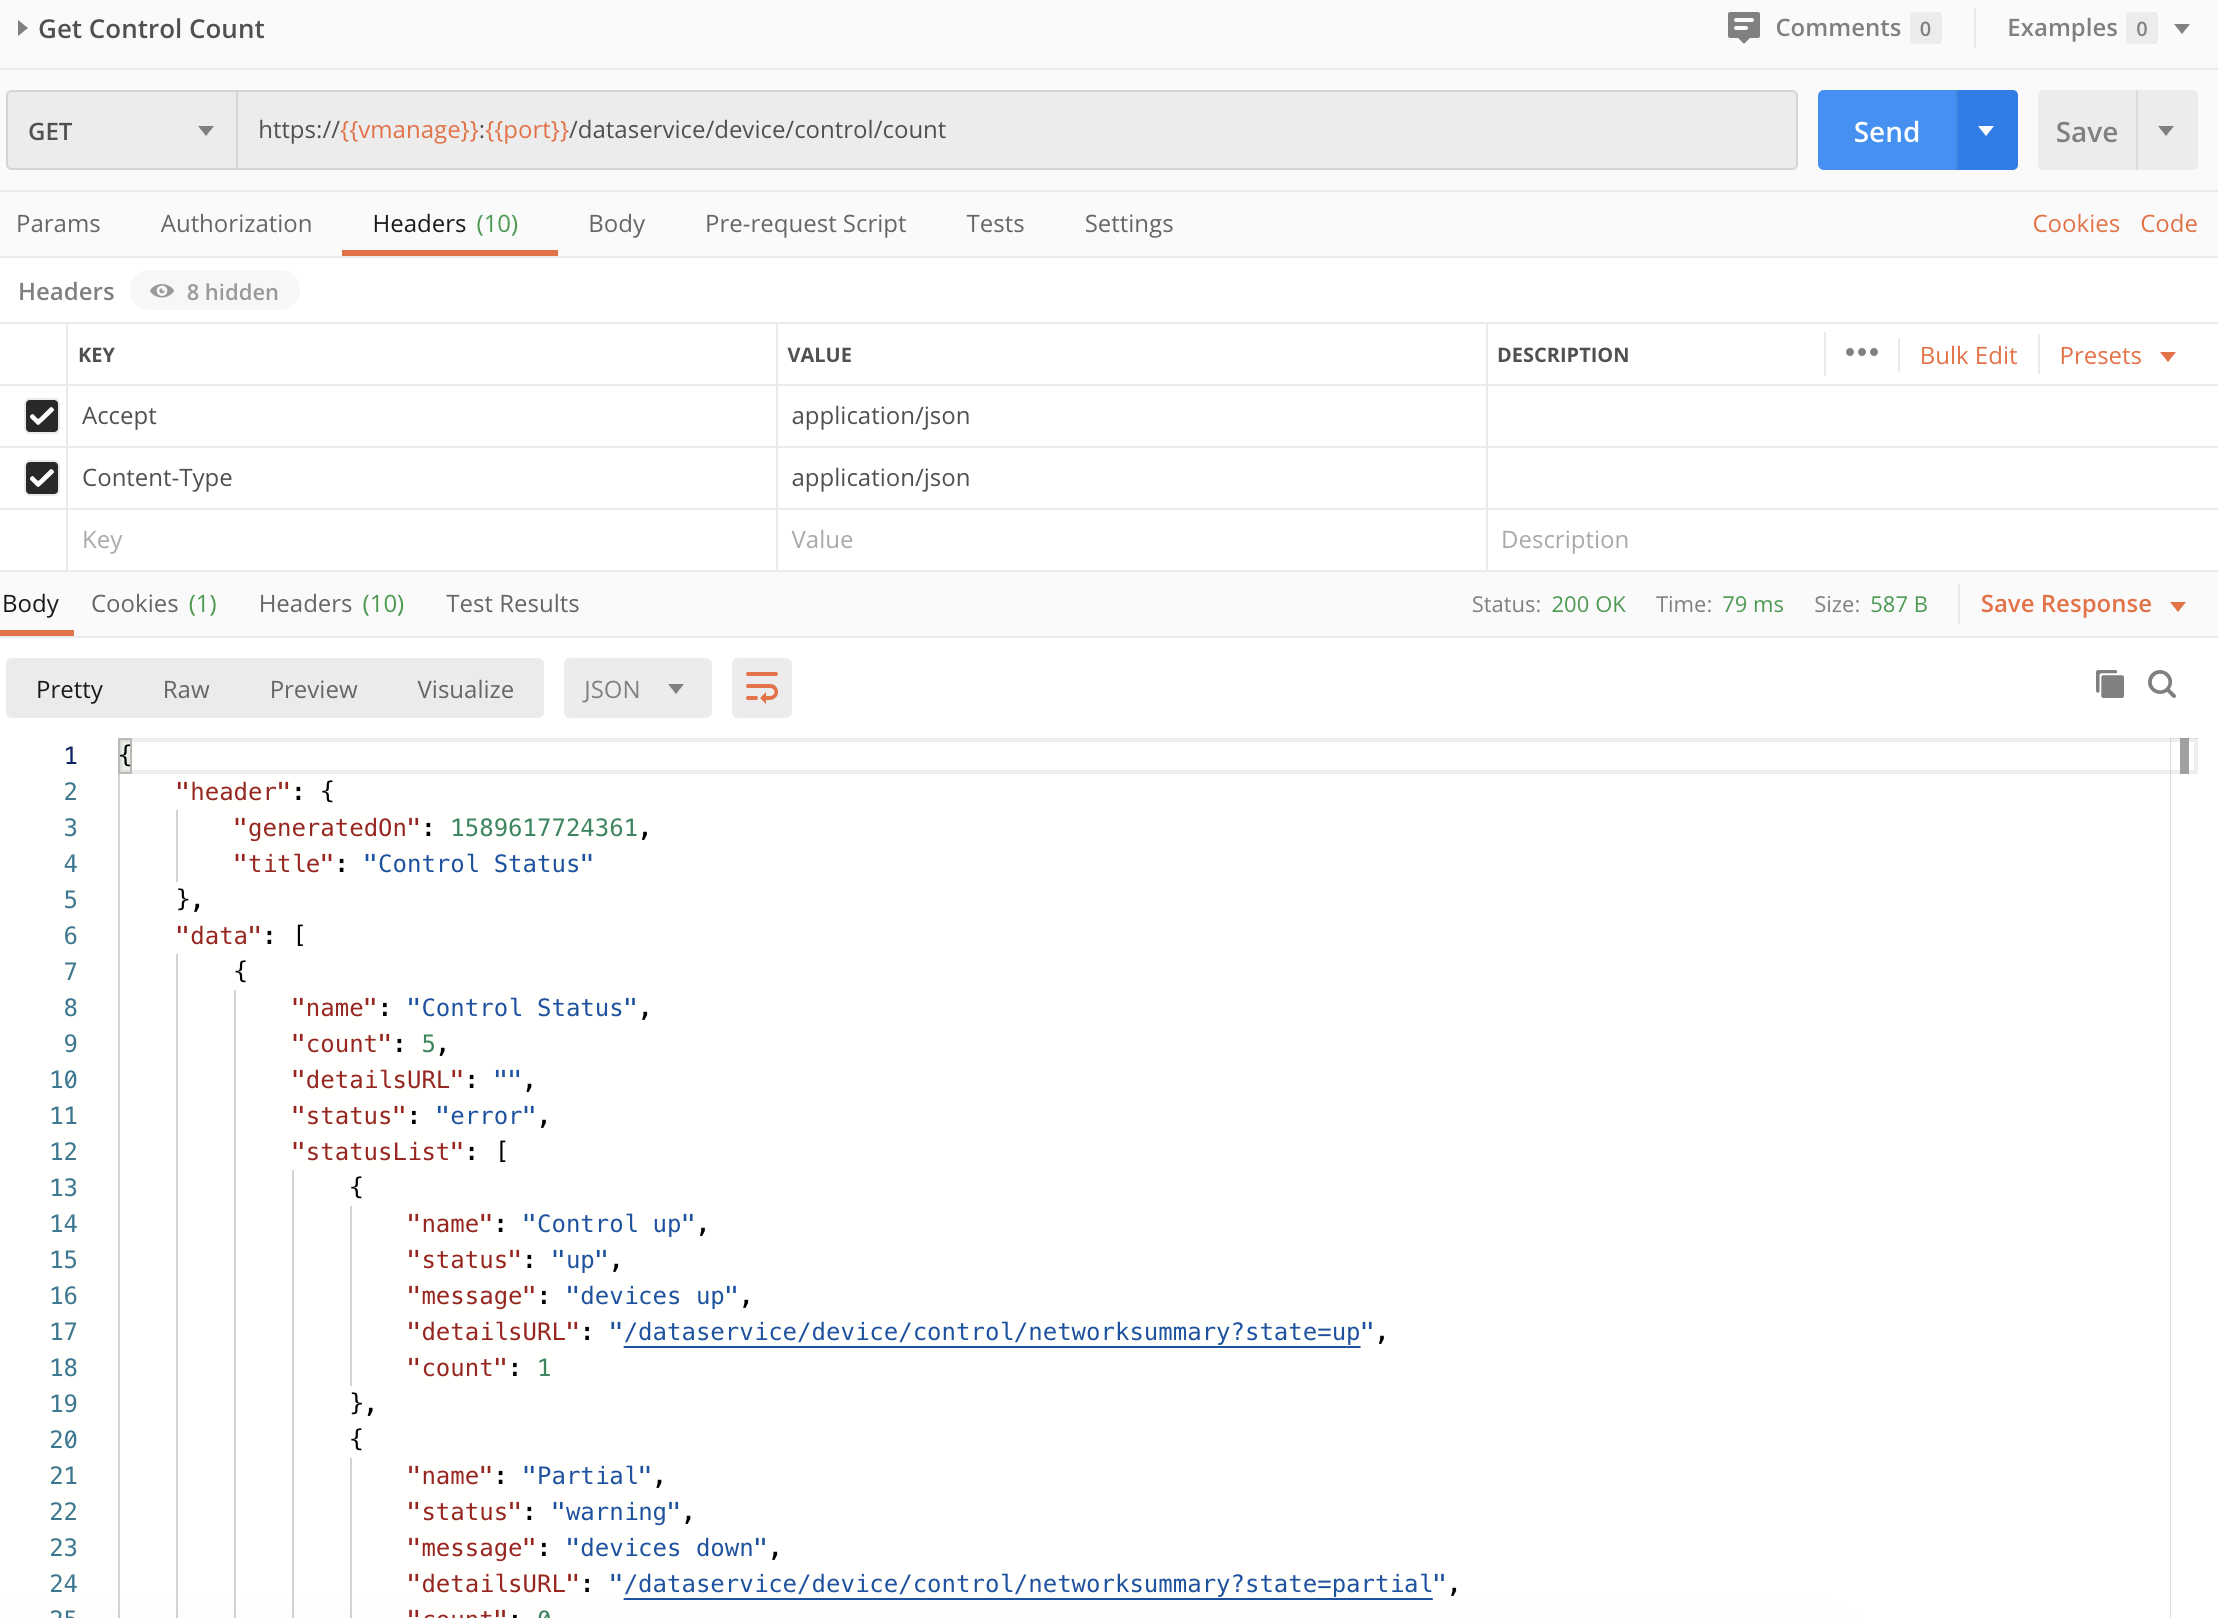
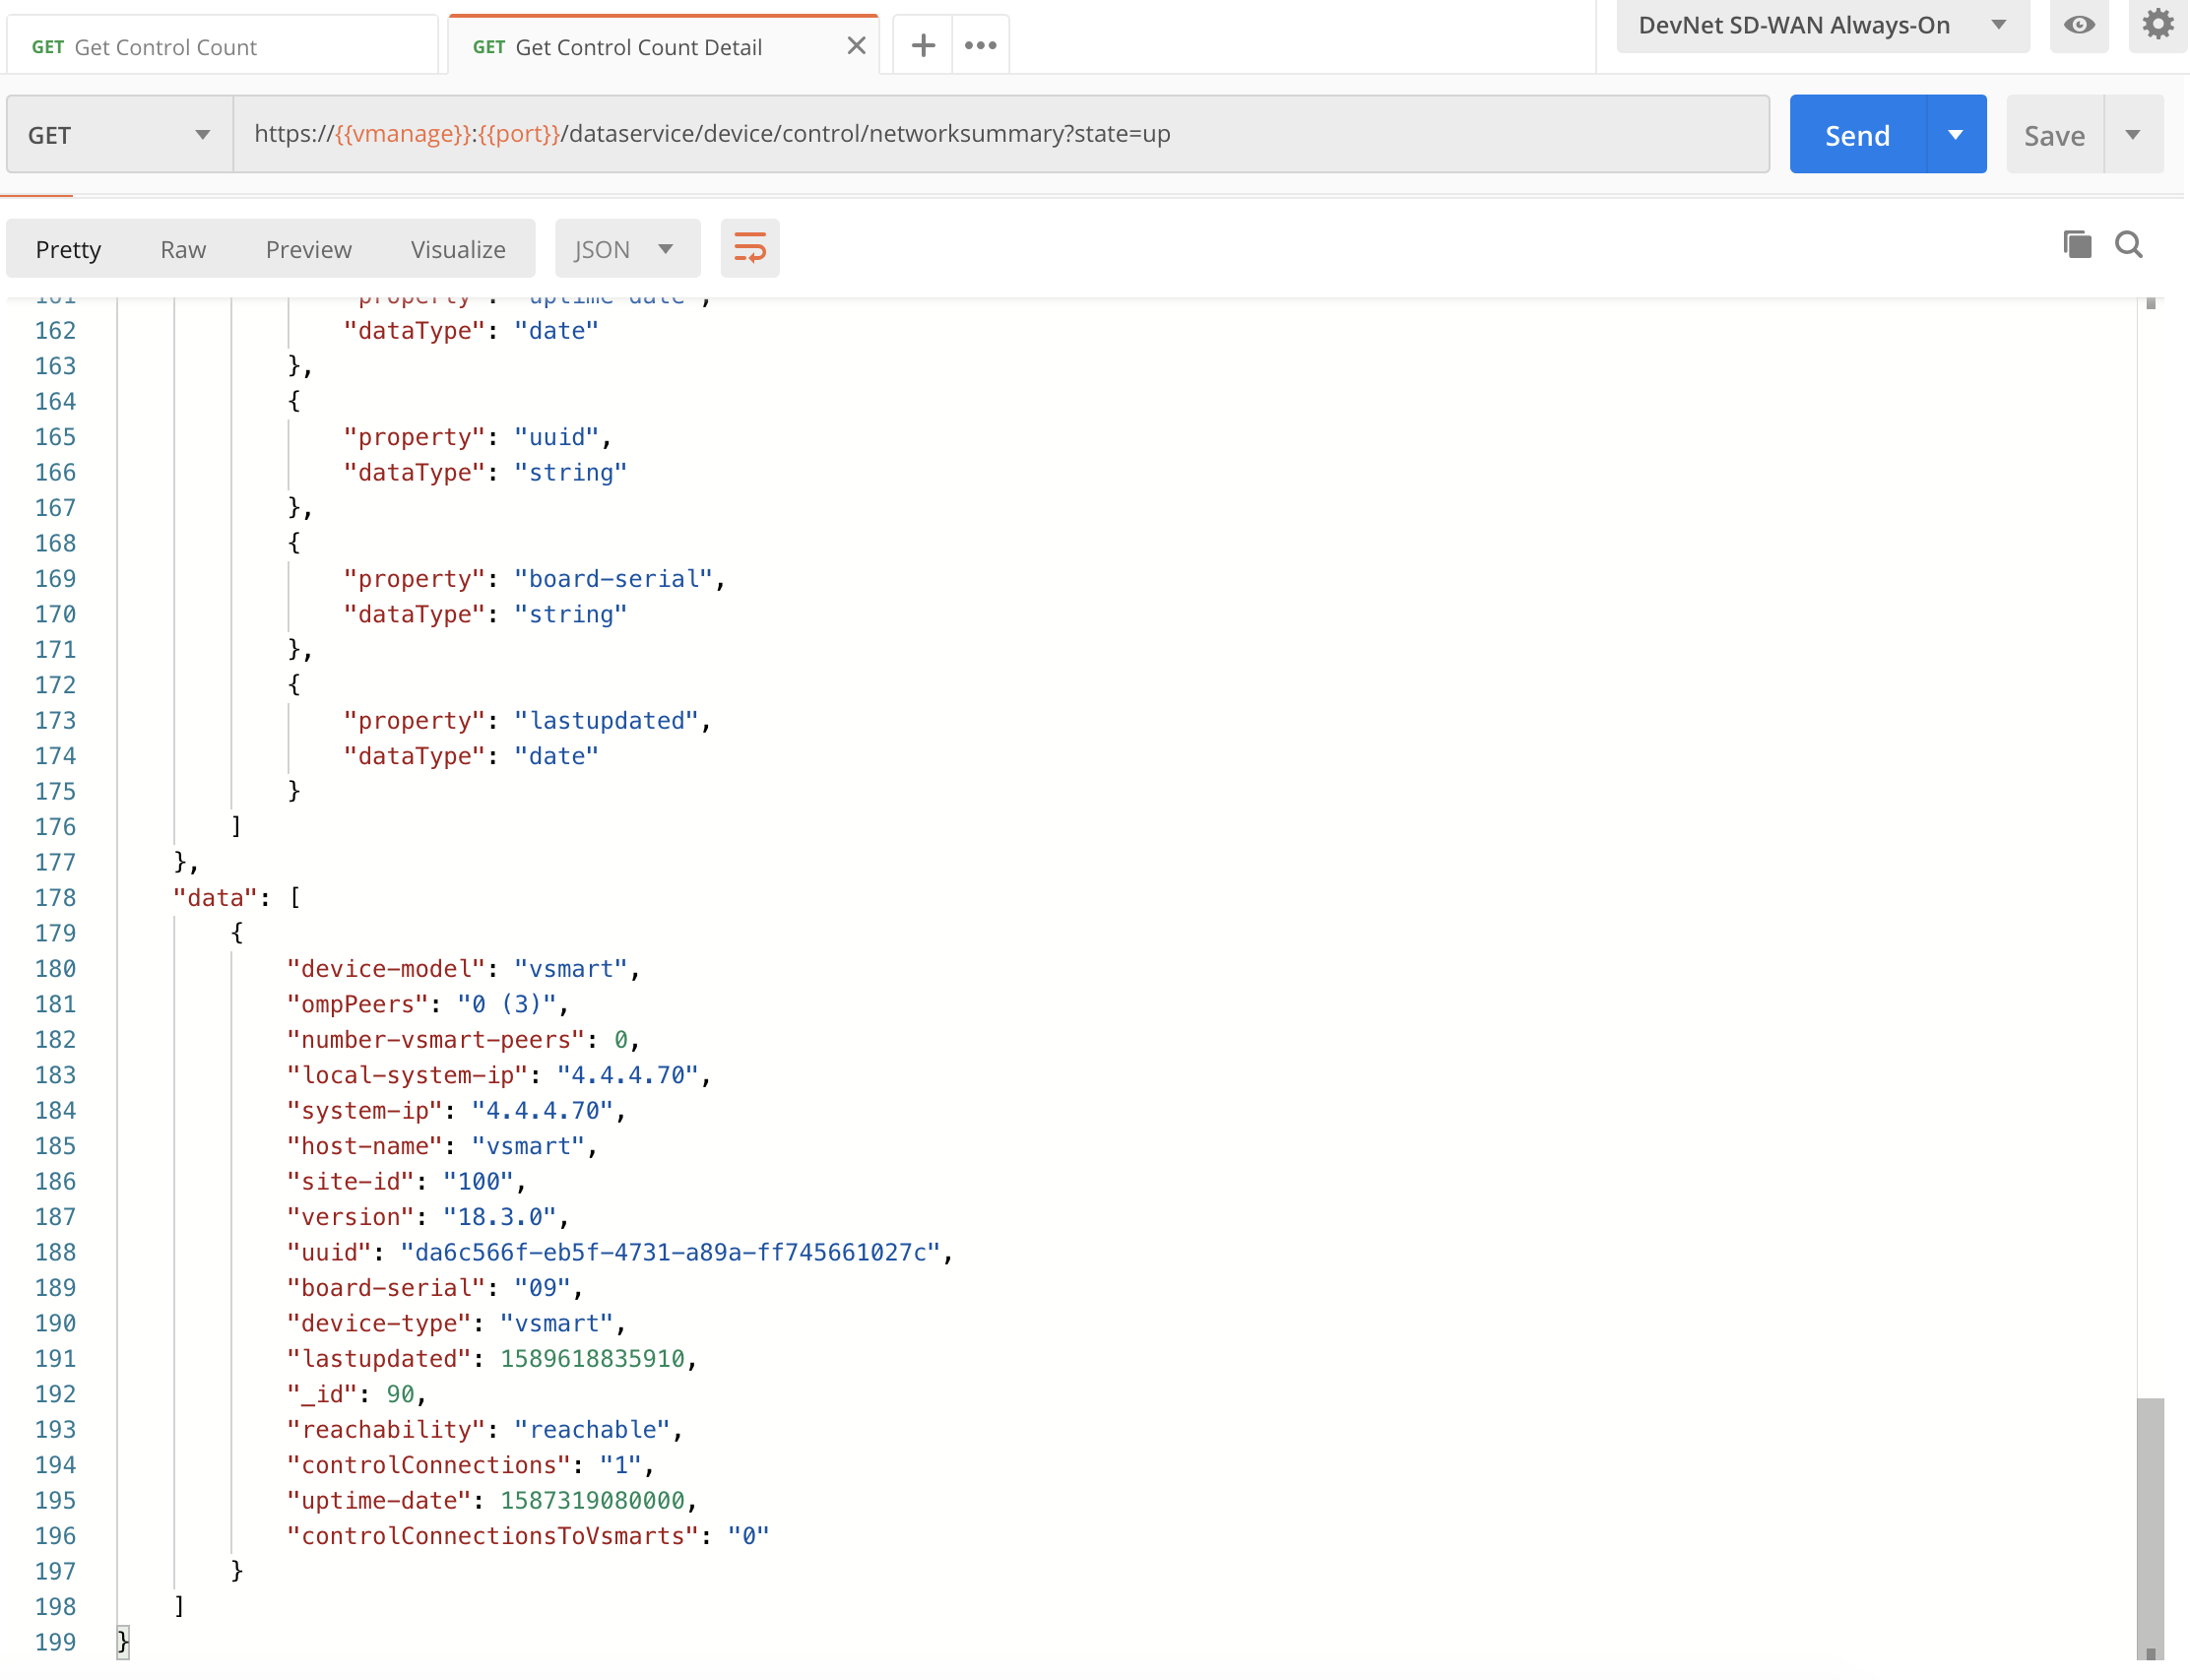
You’ll notice that in the response, we get back a link to more details for that status. This lets us explore which devices are up or down. Let’s explore that further.
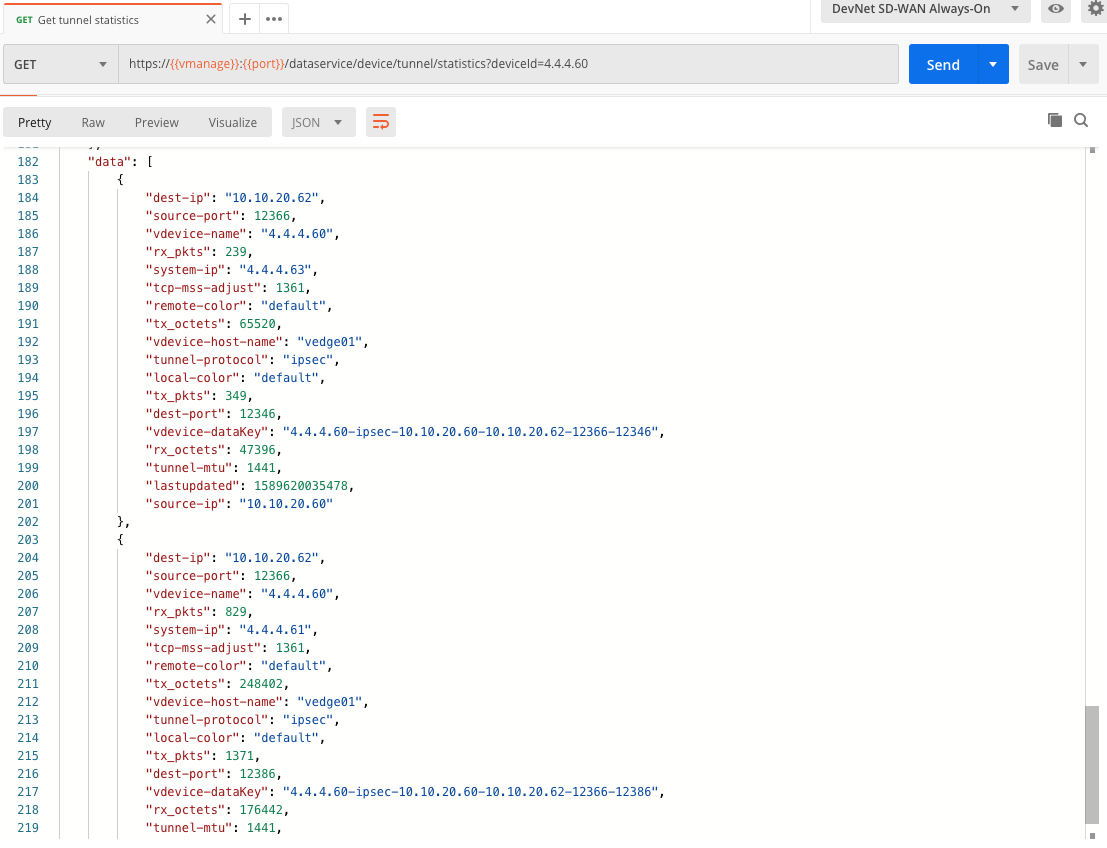
Get Tunnel statistics
In order to retrieve the control count, you can use the /dataservices/device/tunnel/statistics API. Note that we need to specify a deviceId parameter (e.g the IP address)
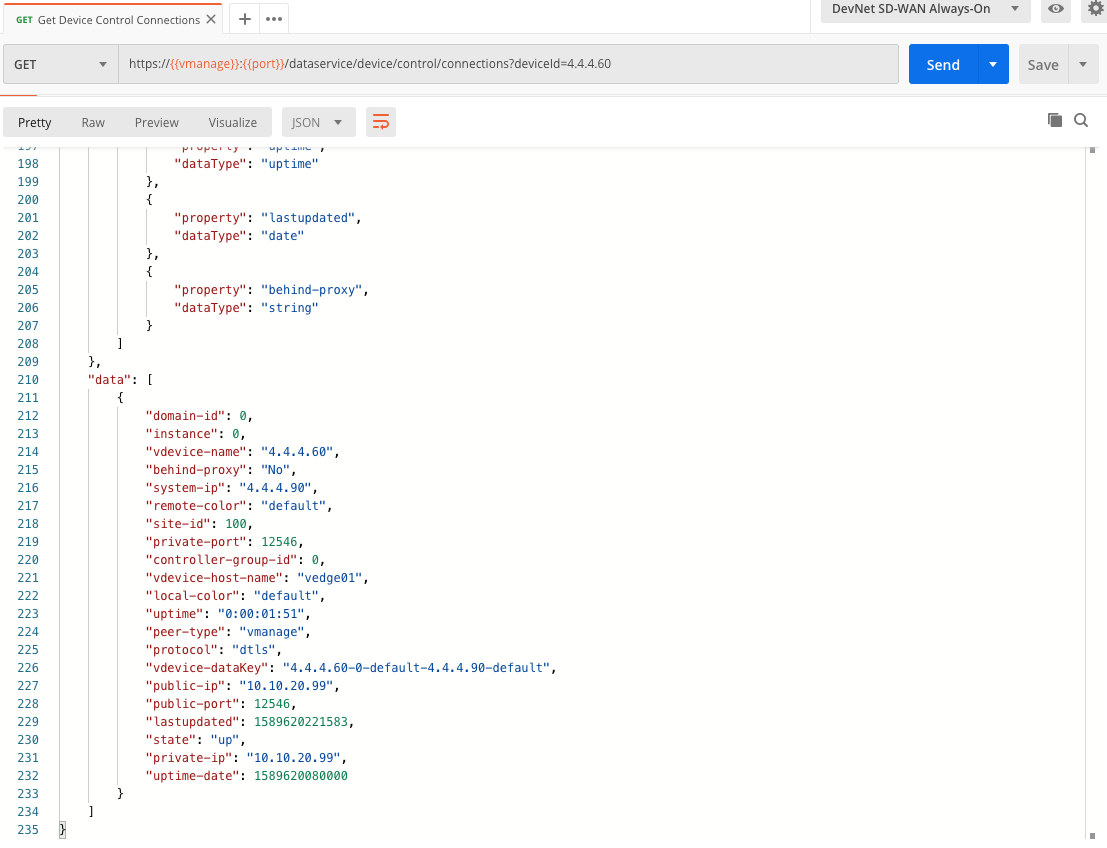
Get Device Control Connections
In order to retrieve the control connections, you can use the /dataservices/device/control/connections API. Note that we need to specify a deviceId parameter (e.g the IP address)
Get CPU stats
In order to retrieve CPU stats, you can use the /dataservices/statistics/system API.
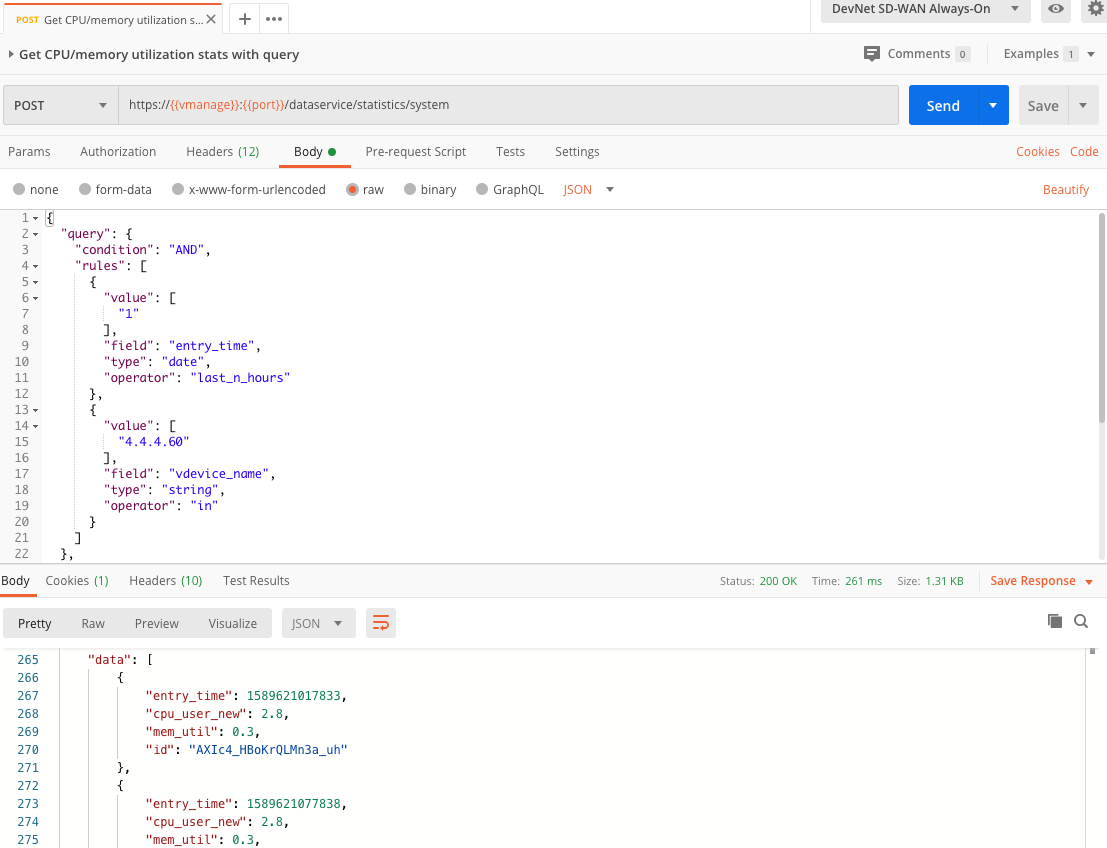
Pay particular attention to the JSON body:
{
  "query": {
    "condition": "AND",
    "rules": [
      {
        "value": [
          "1"
        ],
        "field": "entry_time",
        "type": "date",
        "operator": "last_n_hours"
      },
      {
        "value": [
          "4.4.4.60"
        ],
        "field": "vdevice_name",
        "type": "string",
        "operator": "in"
      }
    ]
  },
  "fields": [
    "entry_time",
    "count",
    "cpu_user_new",
    "mem_util"
  ],
  "sort": [
    {
      "field": "entry_time",
      "type": "date",
      "order": "asc"
    }
  ]
}
Here we have specified two rules:
- Rule 1: the
entry time(of typedate). As the operator islast_n_hoursand the value equals 1, it means we want to check the last 1 hour. - Rule 2: the
vdevice_name(of typestring) must contain the value 4.4.4.60.
The query condition is AND which means that both above rules must be TRUE
The fields (optional) ensures we collect only a few fields, in our example we are interested in the entry_time, the cpu_user_new and the mem_util. Other attributes could have been statcycletime, system-ip, device_model, host_name, runningp (running processes), totalp(total processes), cpu_system_new, cpu_idle, mem_free, mem_buffers, mem_cached, disk_used, disk_avail, min1_avg (CPU), min5_avg (CPU), min15_avg (CPU).
Last, we will want to sort the date on entry_time in ascending order.
The intention of this post was mainly to provide a short overview of some relevant SD-WAN APIs, nothing really more. In a next post, I will provide some Python scripts that implement these API calls.